
AI SR/TL Pro · TradingView® Indicator
AI-Generated Support, Resistance And Trend Lines, Drawn Automatically On Your TradingView® Chart.
Works on ANY Symbol, in nearly EVERY Timeframe.Stocks, futures, forex, crypto, indices, commodities. Seconds to monthly.
AI SR/TL Pro is an invite-only Pine Script™ indicator for TradingView®. Apply it once and up to ten scored price levels, plus as many as six trend lines, are already drawn the moment your chart loads. Your line tool never leaves the toolbar.
It ranks what is already on the chart. It does not predict what comes next.
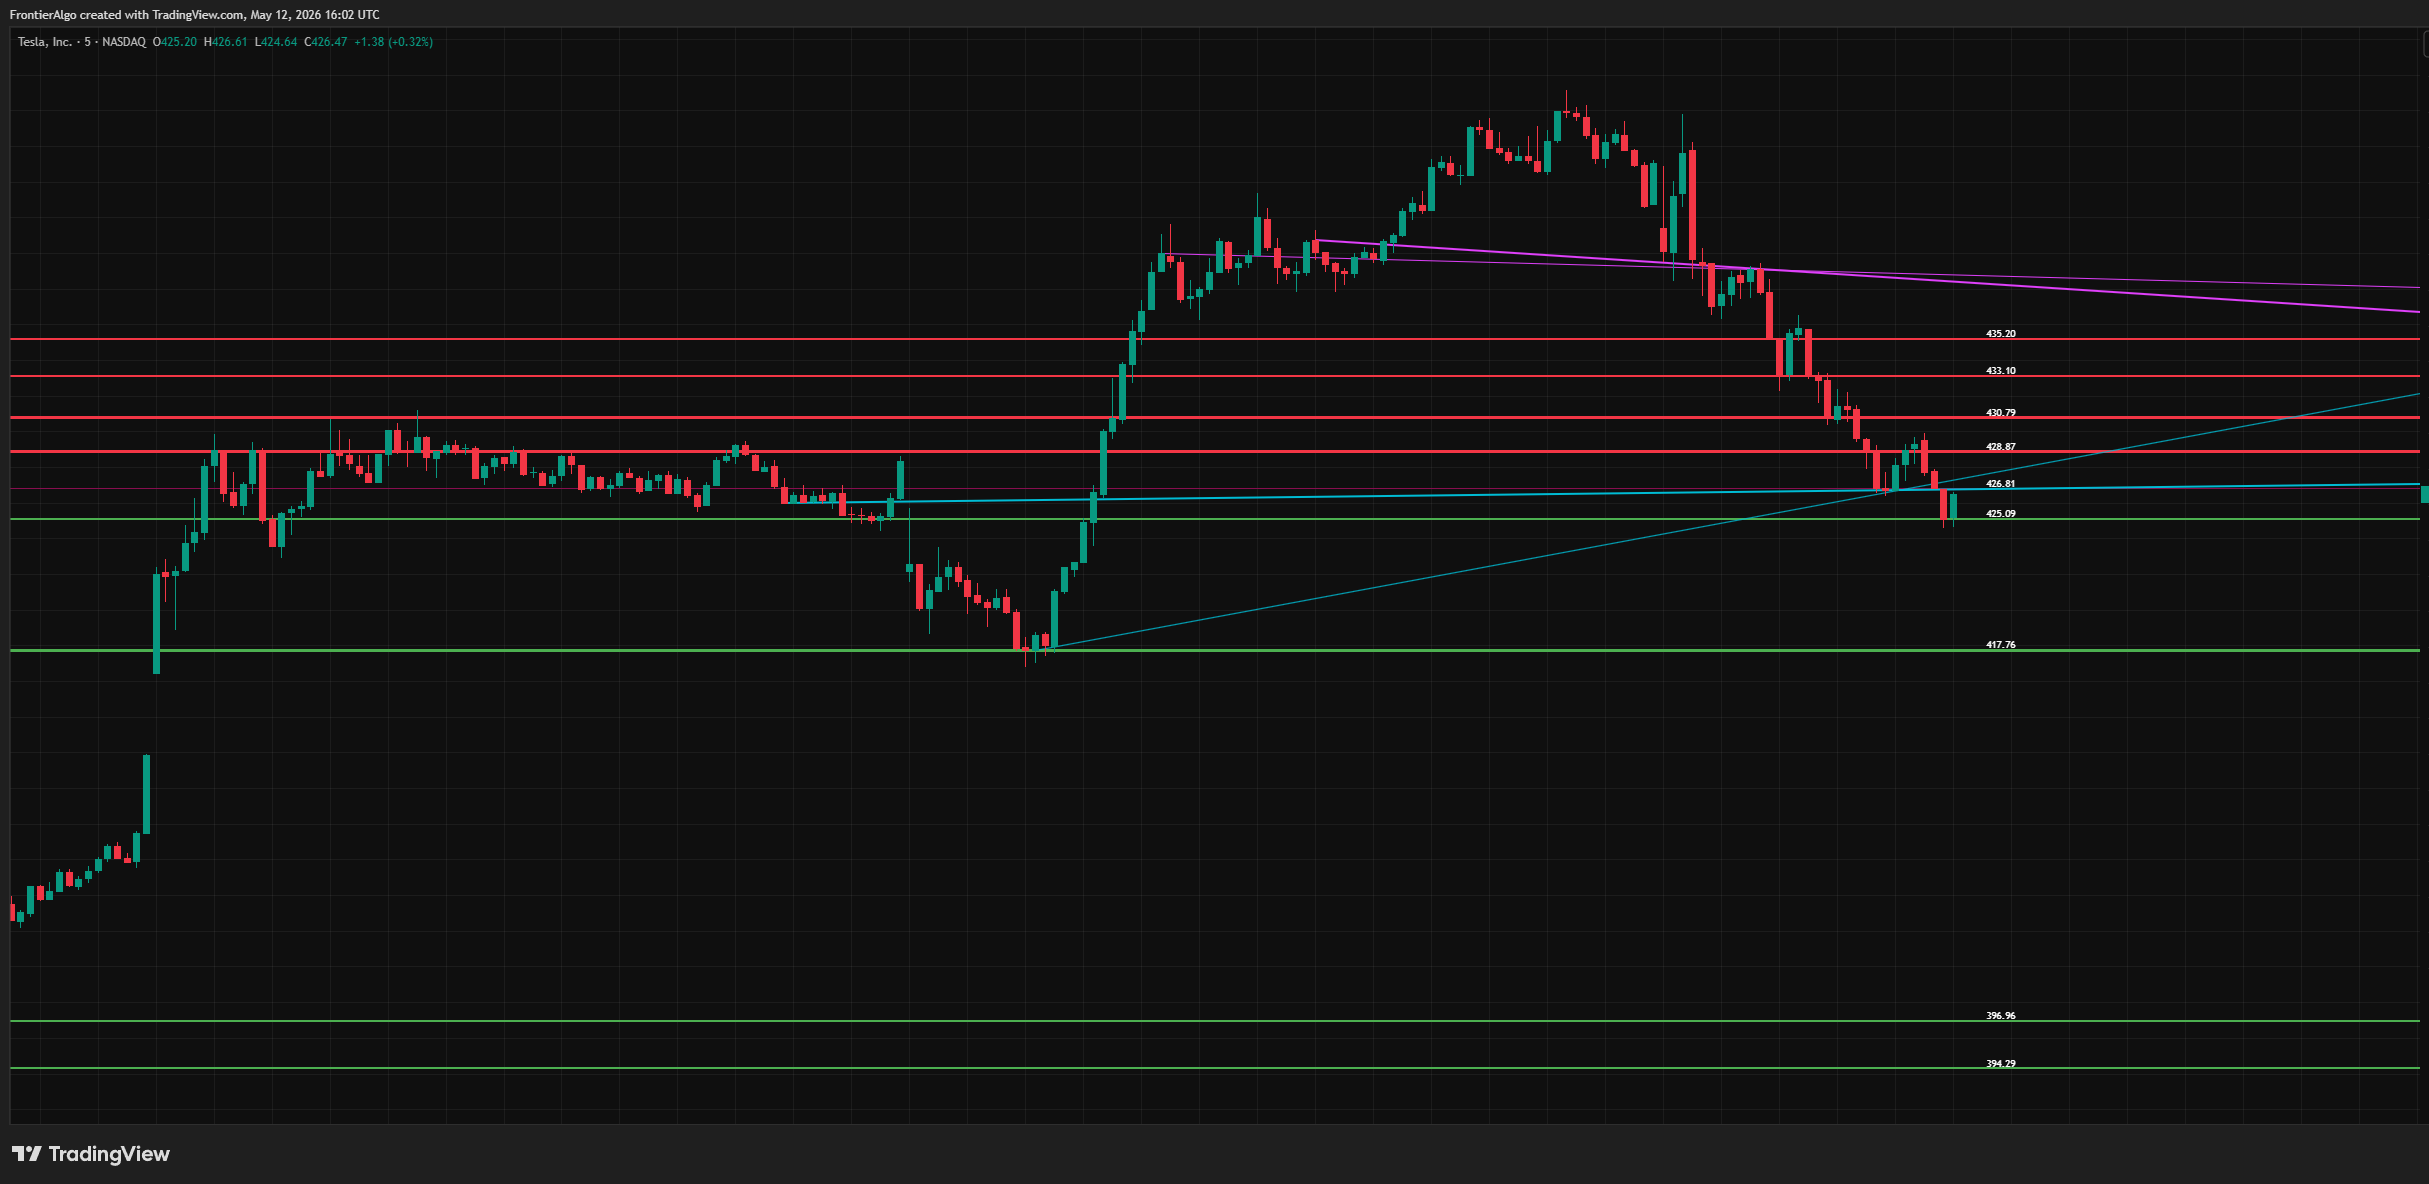
Hypothetical/historical example. CFTC Rule 4.41: results shown are based on historical data and do not represent actual trading. Past performance does not indicate future results.
- Up to five levels above price, five below
- Each one prints its own price at the right edge
- Thick and bright is strong. Thin and dark is weak.
- Trend lines anchored on real pivots, not on your eye
- Same rules on chart one and on chart twelve
- No entry markers. It marks levels, you decide.
- Runs on the free TradingView plan
- One payment. No subscription, no renewal date.
 Invite-Only Pine Script™ v6
AI SR/TL Pro is a technical-analysis indicator for TradingView®, not a trade-recommendation service and not financial advice. Trading involves substantial risk of loss. Past performance is not indicative of future results.
One Chart. The BUY Side And The SELL Side,Both Drawn For You.
The Tesla capture from the top of this page, shown in full and annotated. Ten levels, five each side, every one price-labeled. Not one line here was drawn by hand.
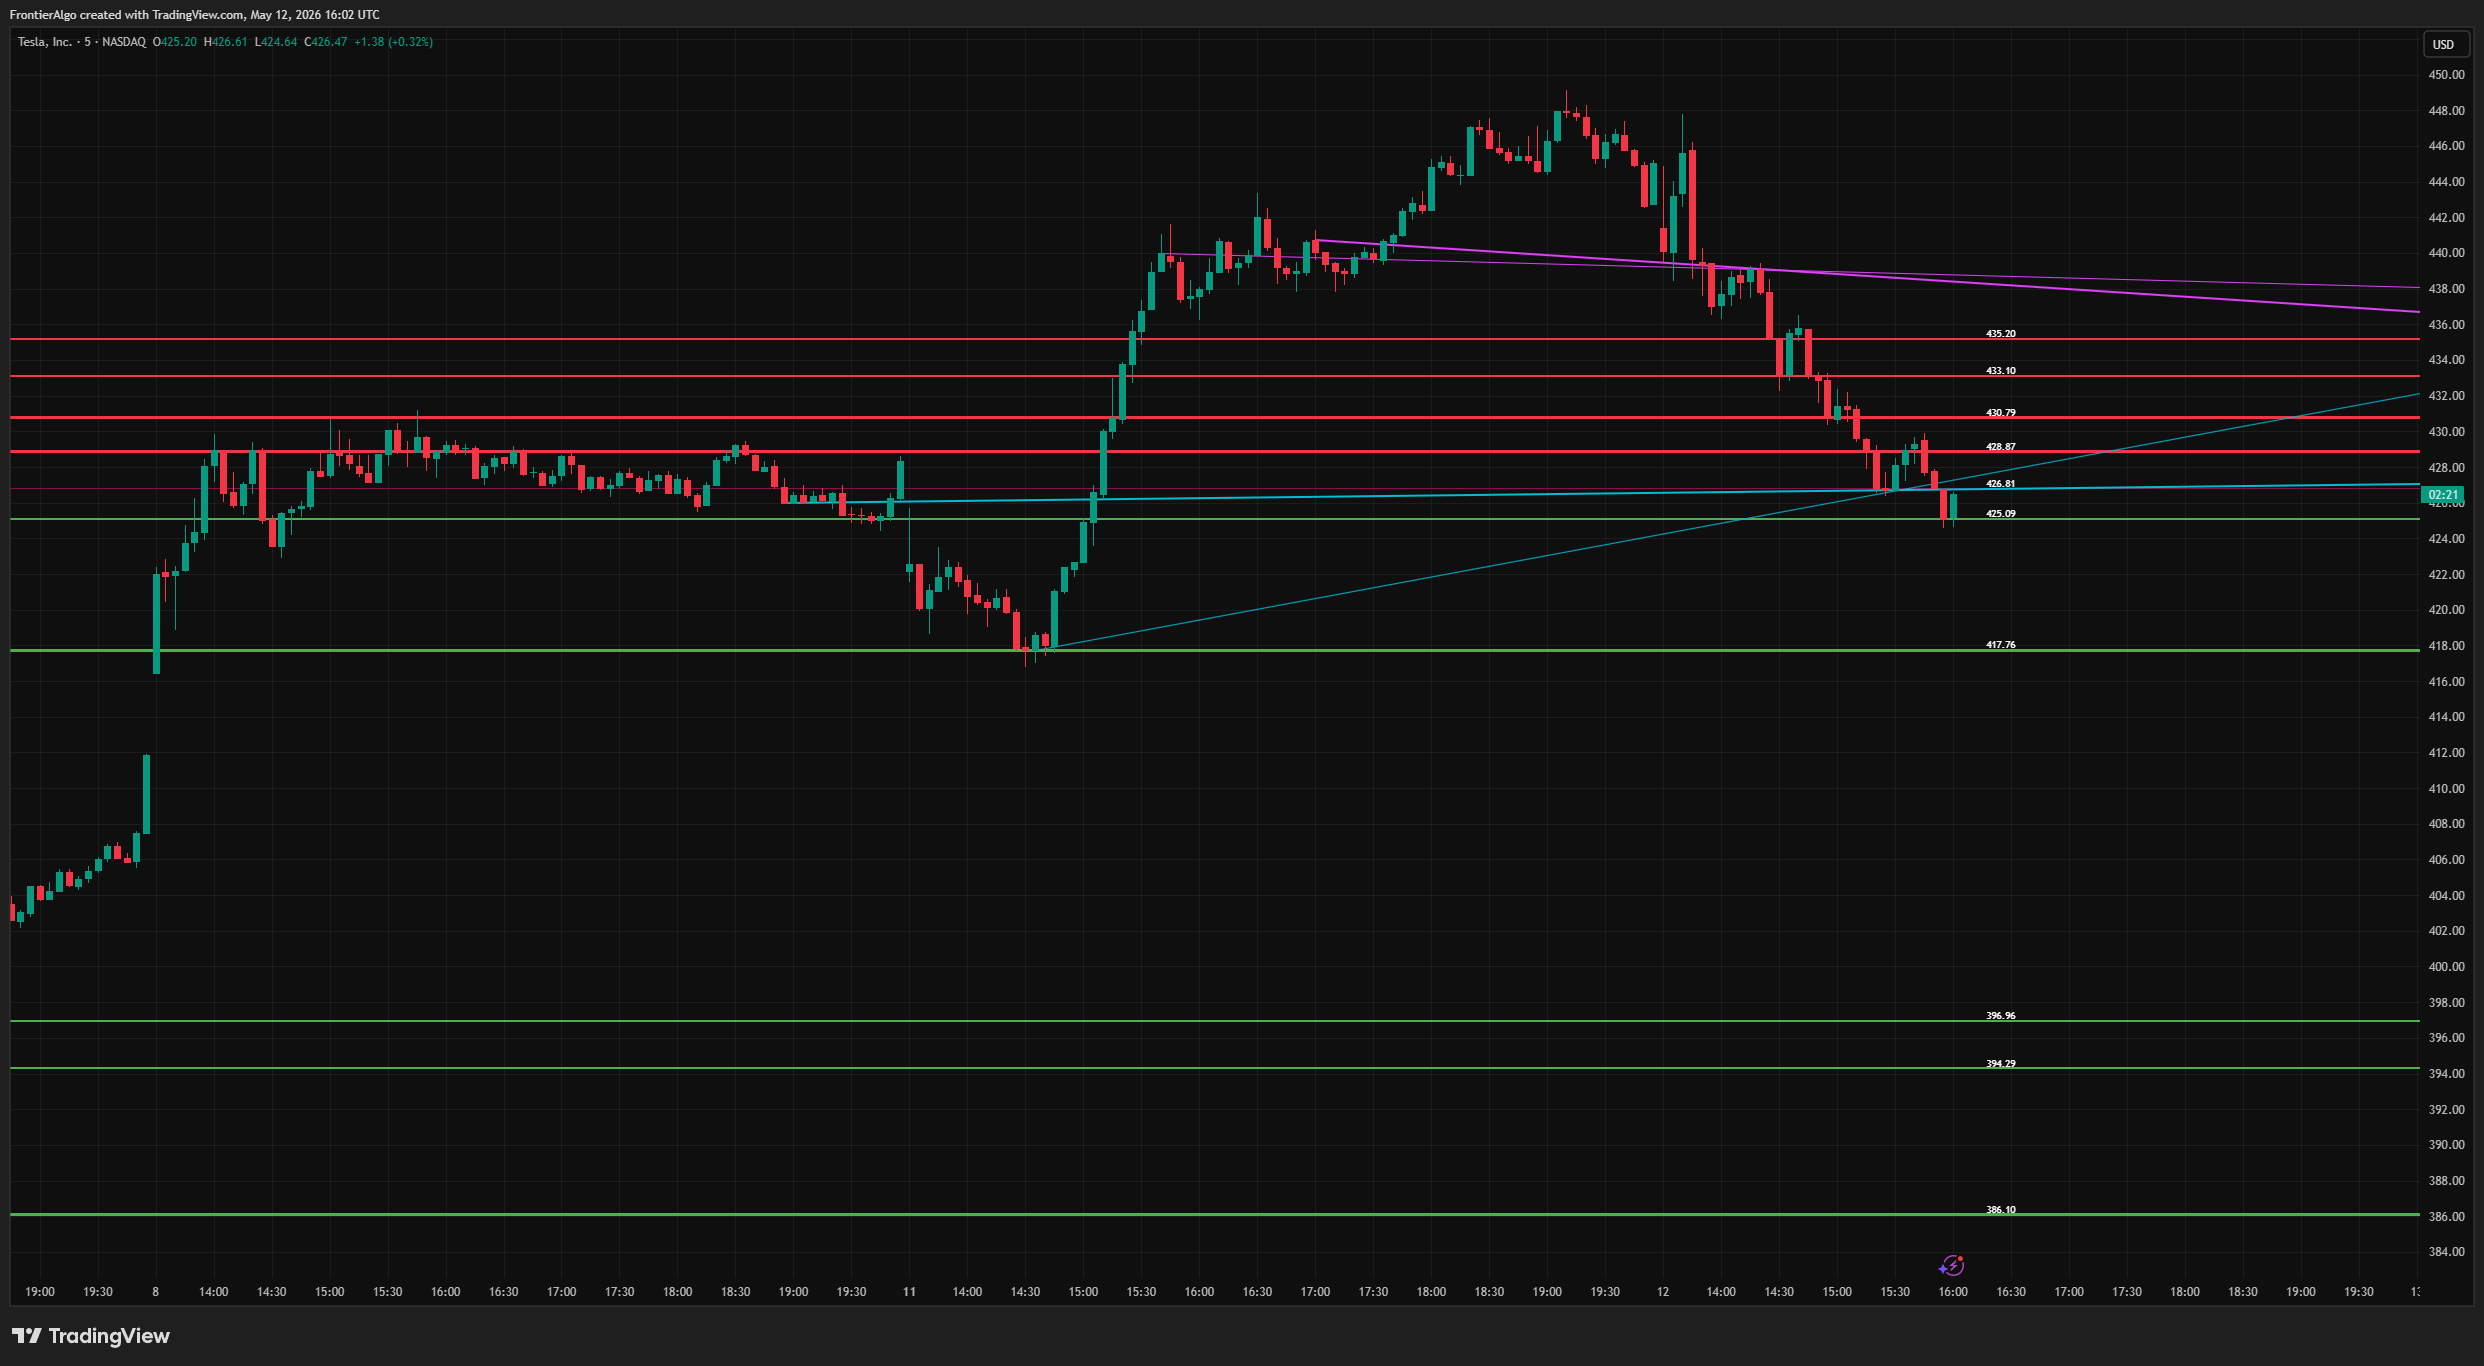 ▸ SELL SIDE · 430.79
▸ BUY SIDE · 417.76
▸ SELL SIDE · 430.79
▸ BUY SIDE · 417.76
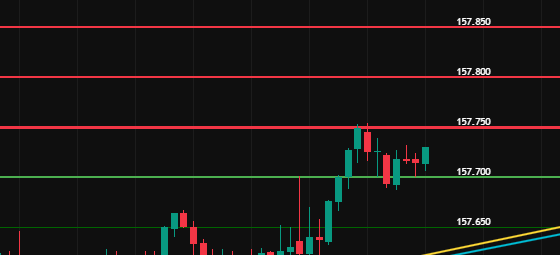
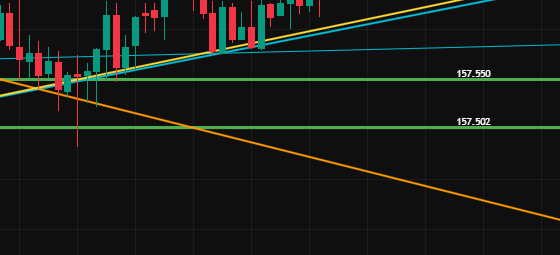
That is the whole vocabulary. Red above price is the SELL side. Green below price is the BUY side. Diagonals are the trend lines. The number beside each level is its price, to your instrument's tick.
Red above price is resistance
Bright red is a level the engine rates. Dark maroon is one it does not. On the Tesla chart, 426.81 is the maroon one, sitting closest to price and deliberately drawn to be ignored.
Green below price is support
Bright green is rated, dark forest green is not. Levels are reclassified the instant price crosses them, so yesterday's support becomes today's resistance without you touching anything.
Diagonals are the trend lines
Cyan rises, magenta falls, on the colors this build ships with. A second, older pair draws in orange and yellow off longer swings, and it ships switched on. Each line is anchored on real swing pivots taken from candle bodies, not on where your eye wanted it to go.
The number on the right edge
Every level prints its own price at tick precision. You read the level instead of measuring it, and you can paste that number straight into a TradingView alert.
Levels, not instructions. AI SR/TL Pro draws and scores price levels and trend lines. It prints no entry markers, sends no alerts of its own, and issues no trade recommendations. What you do at a level stays your decision.
The two red and green tags on the chart above are our own annotations for this walkthrough. The indicator draws the lines and the prices. Nothing else.
It is 9:28 AM. Eight charts to mark, two minutes to do it.
You drag a line across the two obvious highs. A third high ruins it. You nudge the anchor to the wick, then to the body. By 9:31 the open is gone and the chart looks like a spider web.
Every one of those lines was a judgment call. Judgment calls drift. Yours on Tuesday will not match yours on Friday, and neither will match the trader sitting next to you.
So we built the levels to draw themselves, then taught the machine to grade them.
The Hand-Drawn Line Is The Weakest Object On Your Chart
Ask ten traders to mark support on the same chart and you get ten different charts. Hand-drawn levels are subjective, inconsistent and slow. In that order.
Two touches or three? There is no rule. You pick, and the level you pick is the level you defend. That is not analysis, that is commitment bias.
Wick or body? Anchor to the wick and one panic spike invents a level nobody trades. Anchor to the body and you argue with yourself about which body.
Nothing ranks them. Twelve lines on a chart and every one looks equally important, because every one is the same width. Your eye has no way to sort them.
Broken lines stay on the chart. Price blew through it in March. It is October. That line is still sitting there because deleting it never made the to-do list.
It does not scale. One chart takes ninety seconds. Twelve charts takes your whole pre-open, and by chart nine you are being sloppy and you know it.
Up To Ten Levels. Up To Six Trend Lines.One Click.
AI SR/TL Pro is an invite-only Pine Script™ for TradingView®. You apply it once. Eight detectors feed a candidate list, six stages cut it down, and what survives prints as up to the five nearest support and five nearest resistance levels with their exact prices.
Harvest
Eight detectors run at once: body-anchored pivot highs and lows, plus the 50, 150 and 300-bar extremes in both directions. Pivots use candle bodies, so a single panic wick cannot invent a level.
Clean
Every candidate rounds to the instrument's own tick size. Anything sitting within 0.8×ATR of a neighbor is merged into it. You get one line, not a smear of five.
Classify
Levels above the current close become resistance. Levels below become support. The moment price crosses one, the classification flips on its own.
Retire
Three consecutive closes more than 1.5×ATR through a level and it is deleted outright. Broken levels do not linger on your chart pretending to matter.
Score
Every survivor is graded from 0.10 to 0.95. That grade drives both the color and the line thickness, so the ranking arrives on the chart instead of in a panel you have to read.
Draw
Up to the five nearest levels per side print with their price. When real structure runs thin, the engine fills that side in with round numbers until it has three, so a ceiling is never simply blank. Those filled-in levels go through the same scoring as everything else, so one can end up drawn bright if price has been respecting it.
Strength scores measure how strongly the engine rates a level's significance. They are not win rates, not probabilities of profit, and not a forecast of what price will do next.
Three Models. One Question. Every Touch.
This is the part the hero deliberately left out, because you do not buy an architecture. Now that you know what lands on the chart, here is what does the grading.
The question all three answer
“When price touched this level, did it hold for the next five bars without closing more than 0.5×ATR through it?”
A touch counts inside 0.3×ATR of the level. That question gets asked of every touch inside the training window, on the instrument and timeframe in front of you. Nothing is imported from another market and nothing is pre-trained in a lab.
Pattern recognition
A nearest-neighbour classifier using Lorentzian distance, chosen because it stays stable when a market goes wild. It finds the historically similar market states and asks how price behaved at this level in those states.
Feature-interaction regression
Logistic regression trained by gradient descent over 30 passes. Six inputs per touch (touch count, recency, momentum, volatility regime, bar range, and where the bar closed inside its range) plus two interaction terms, because combinations behave differently from their parts.
Bayesian hold-rate
A Beta-Binomial estimator with a symmetric Beta(2,2) prior. It starts with no opinion and moves toward strong only as holds accumulate, reporting its own uncertainty as it goes. Two holds out of two is not the same evidence as forty out of forty, and the score says so.
The ensemble weights certainty, not headcount
Most ensembles take a vote. This one measures how far each model sits from the fence, then hands out influence accordingly. A model that is unsure barely speaks. A model that is certain dominates.
The combined score is clamped between 0.10 and 0.95. It never bottoms out at zero and it never claims certainty. That clamp is in the code, not in the marketing.
These scores represent how strongly the three models agree that a level is significant. They do not represent win rates, success rates, or the probability of profit.
What The Chart Gives You Back
- Your pre-open half hour, back. Load the chart, read the levels, move on to the next symbol.
- One version of the chart. The same rules run today, tomorrow, and on the symbol you have never traded before.
- A ranking, not a pile. Thick and bright is where the evidence is. Thin and dark can wait, and it looks like it can wait.
- Numbers you can act on. Every level arrives price-labeled, ready to paste into a TradingView alert.
- A watchlist you can actually scan. Twelve symbols read in the time one used to take to draw.
- Nothing to maintain. No Sunday re-optimizing, no settings file, no second-guessing a lookback you picked six months ago.
AI SR/TL Pro is an analysis tool. It does not place trades, size positions, or manage risk for you.
Three More Markets. Two Timeframes. Same Engine, Untouched.
Every screenshot below was captured on 12 May 2026. Read the numbers on the right edge of each chart, then read the line weights.
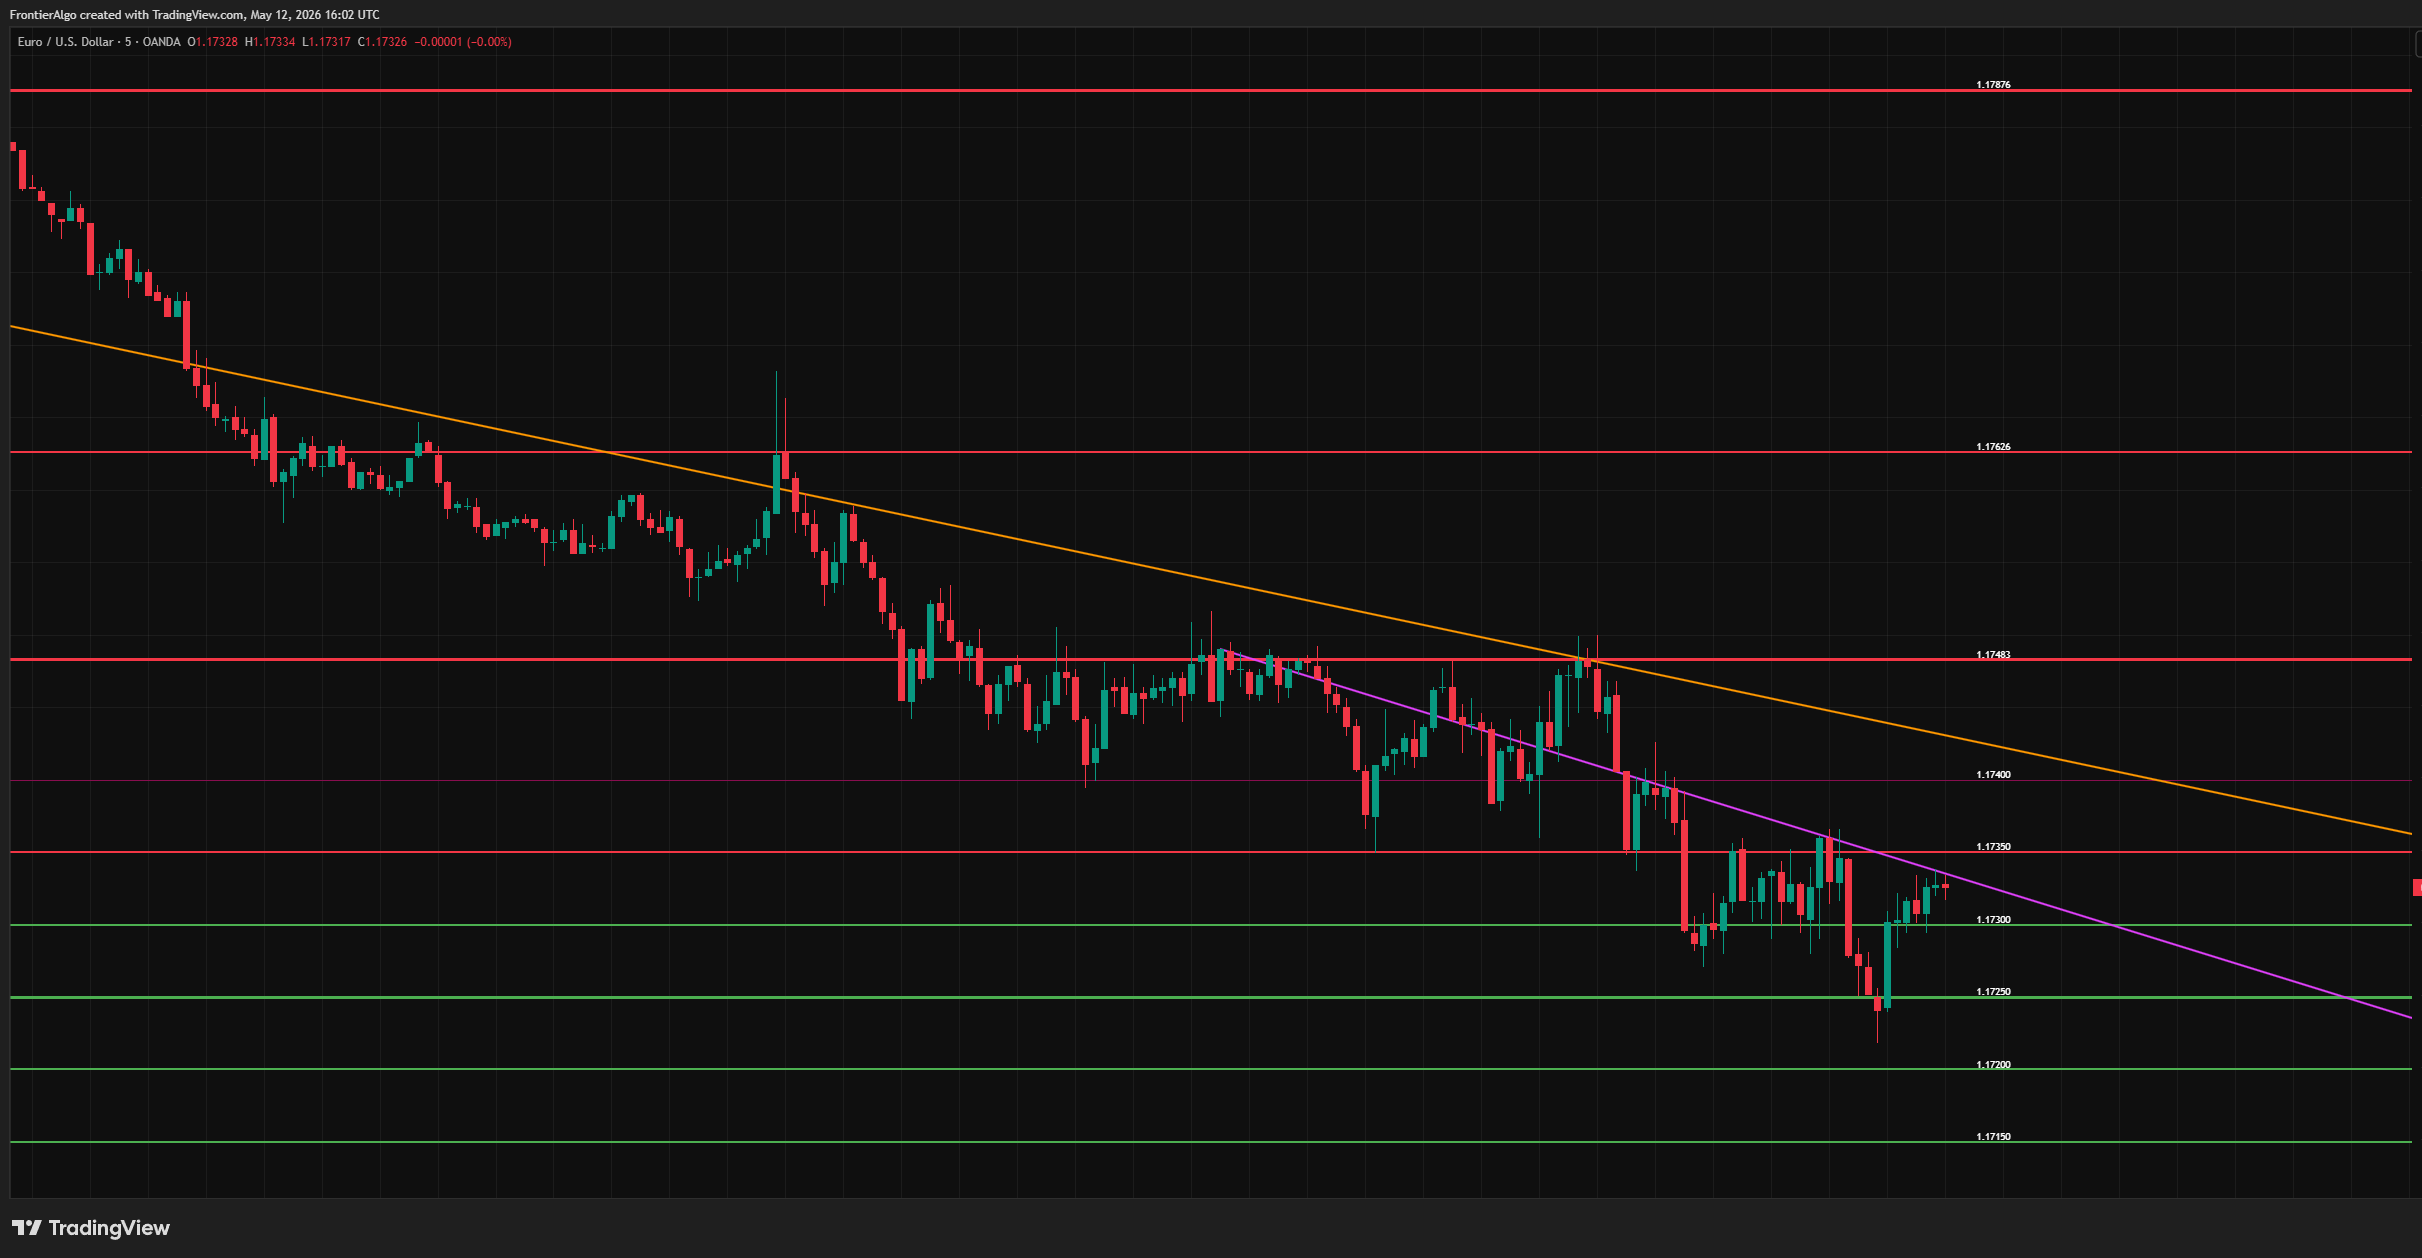
Hypothetical/historical example. CFTC Rule 4.41: results shown are based on historical data and do not represent actual trading. Past performance does not indicate future results.
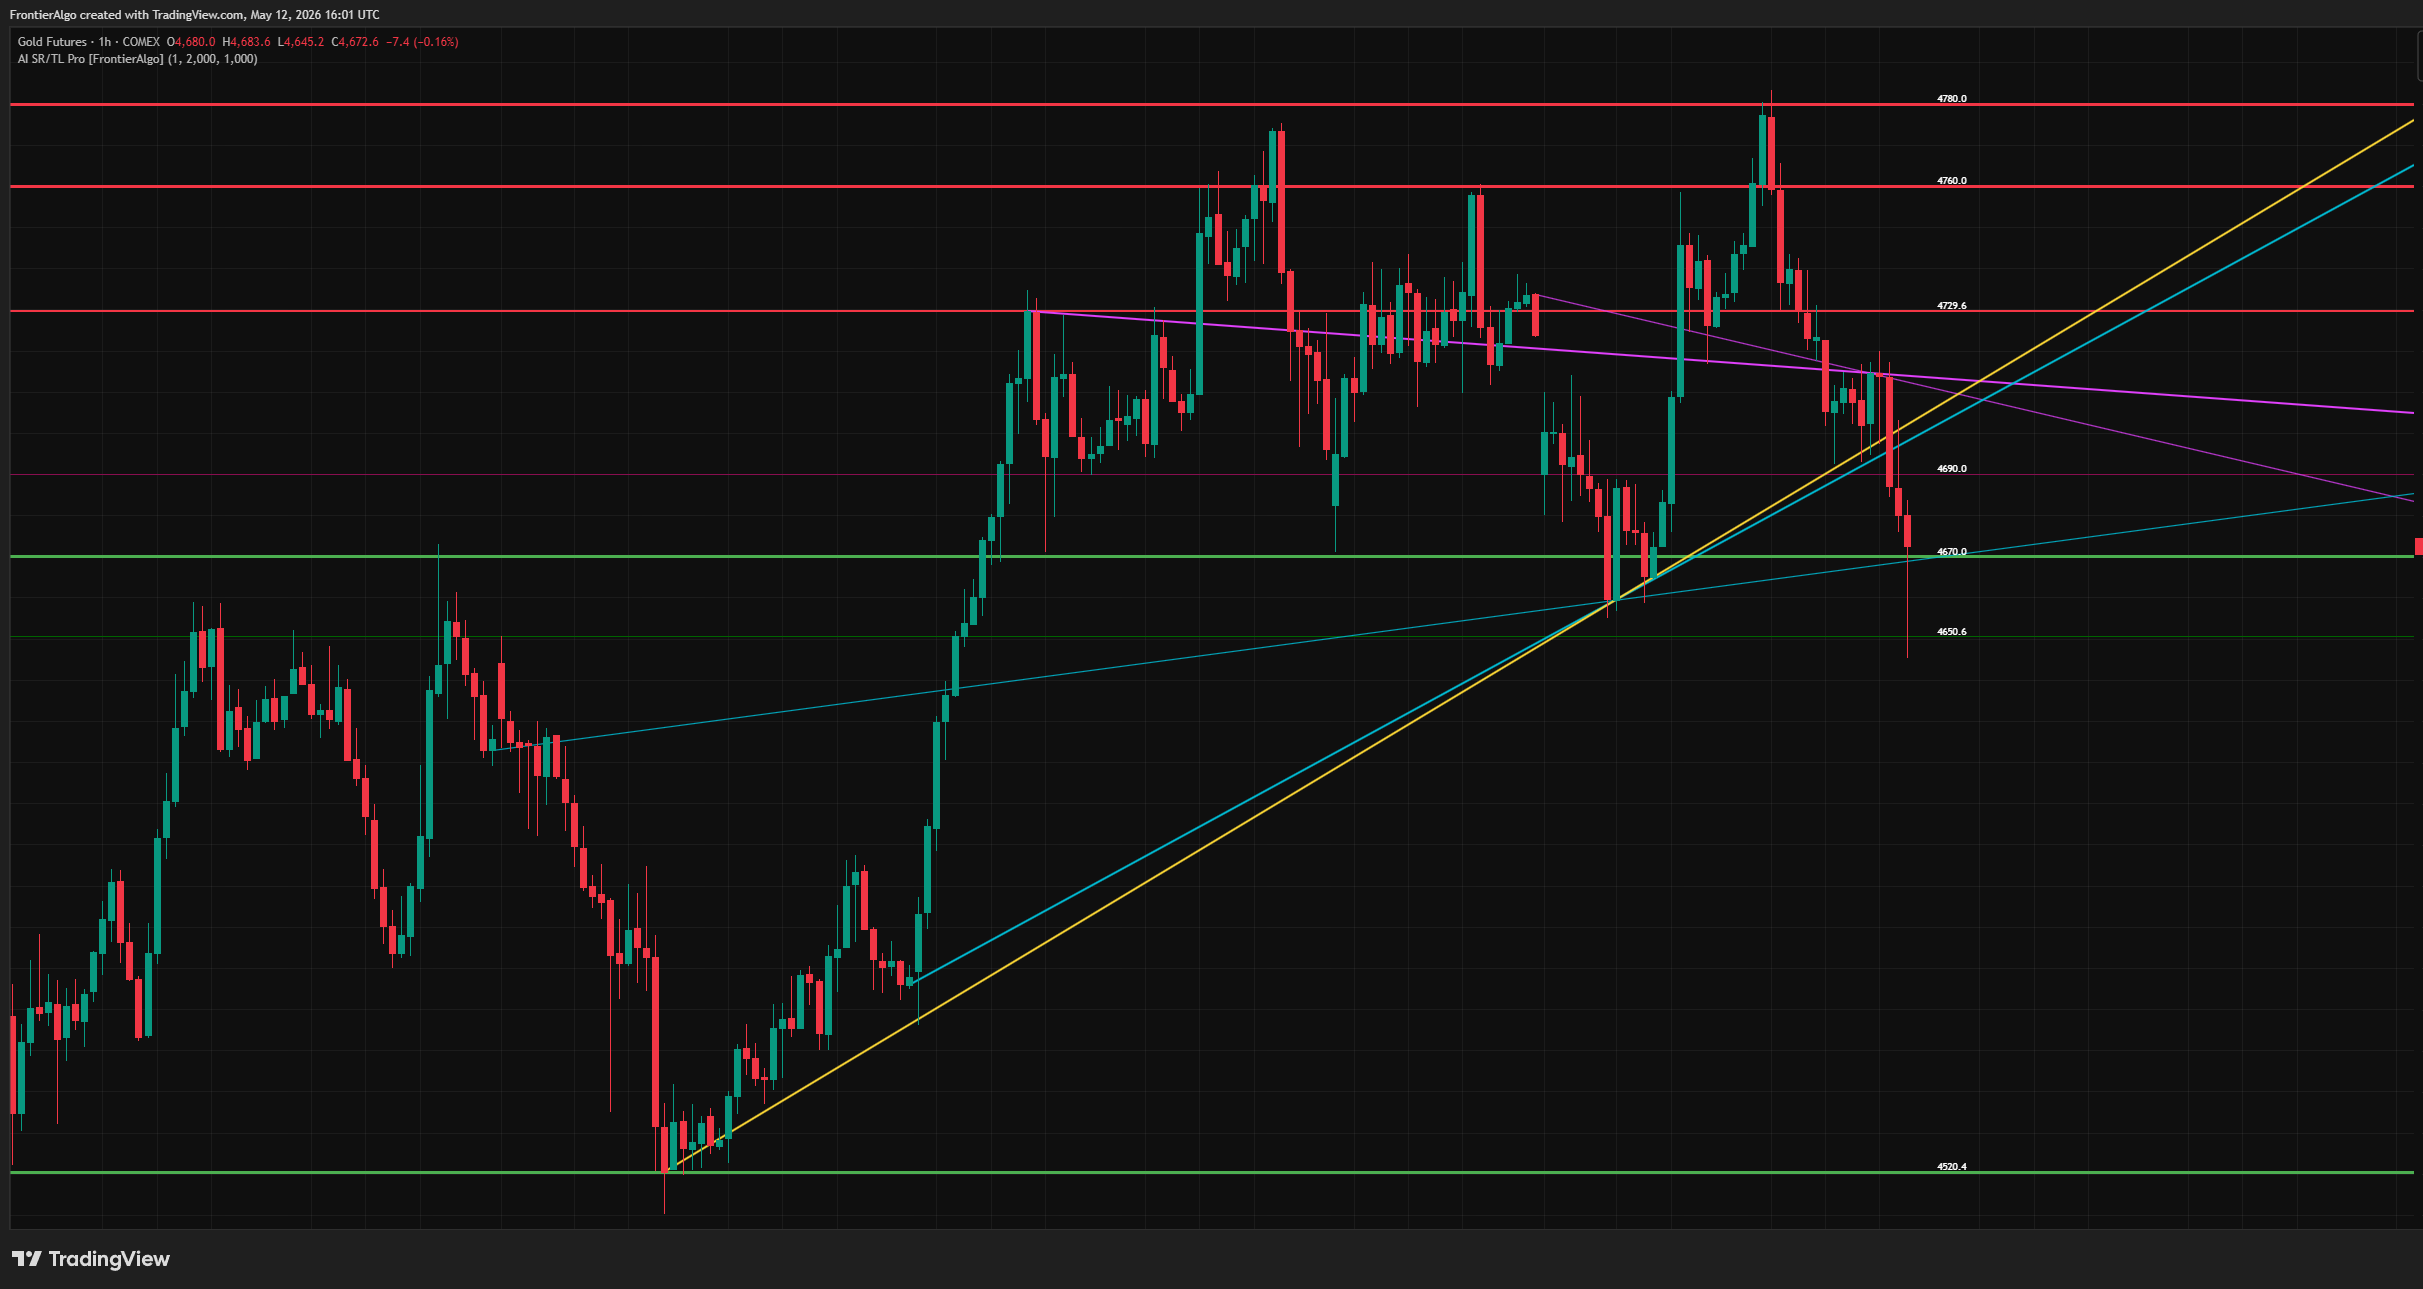
Hypothetical/historical example. CFTC Rule 4.41: results shown are based on historical data and do not represent actual trading. Past performance does not indicate future results.
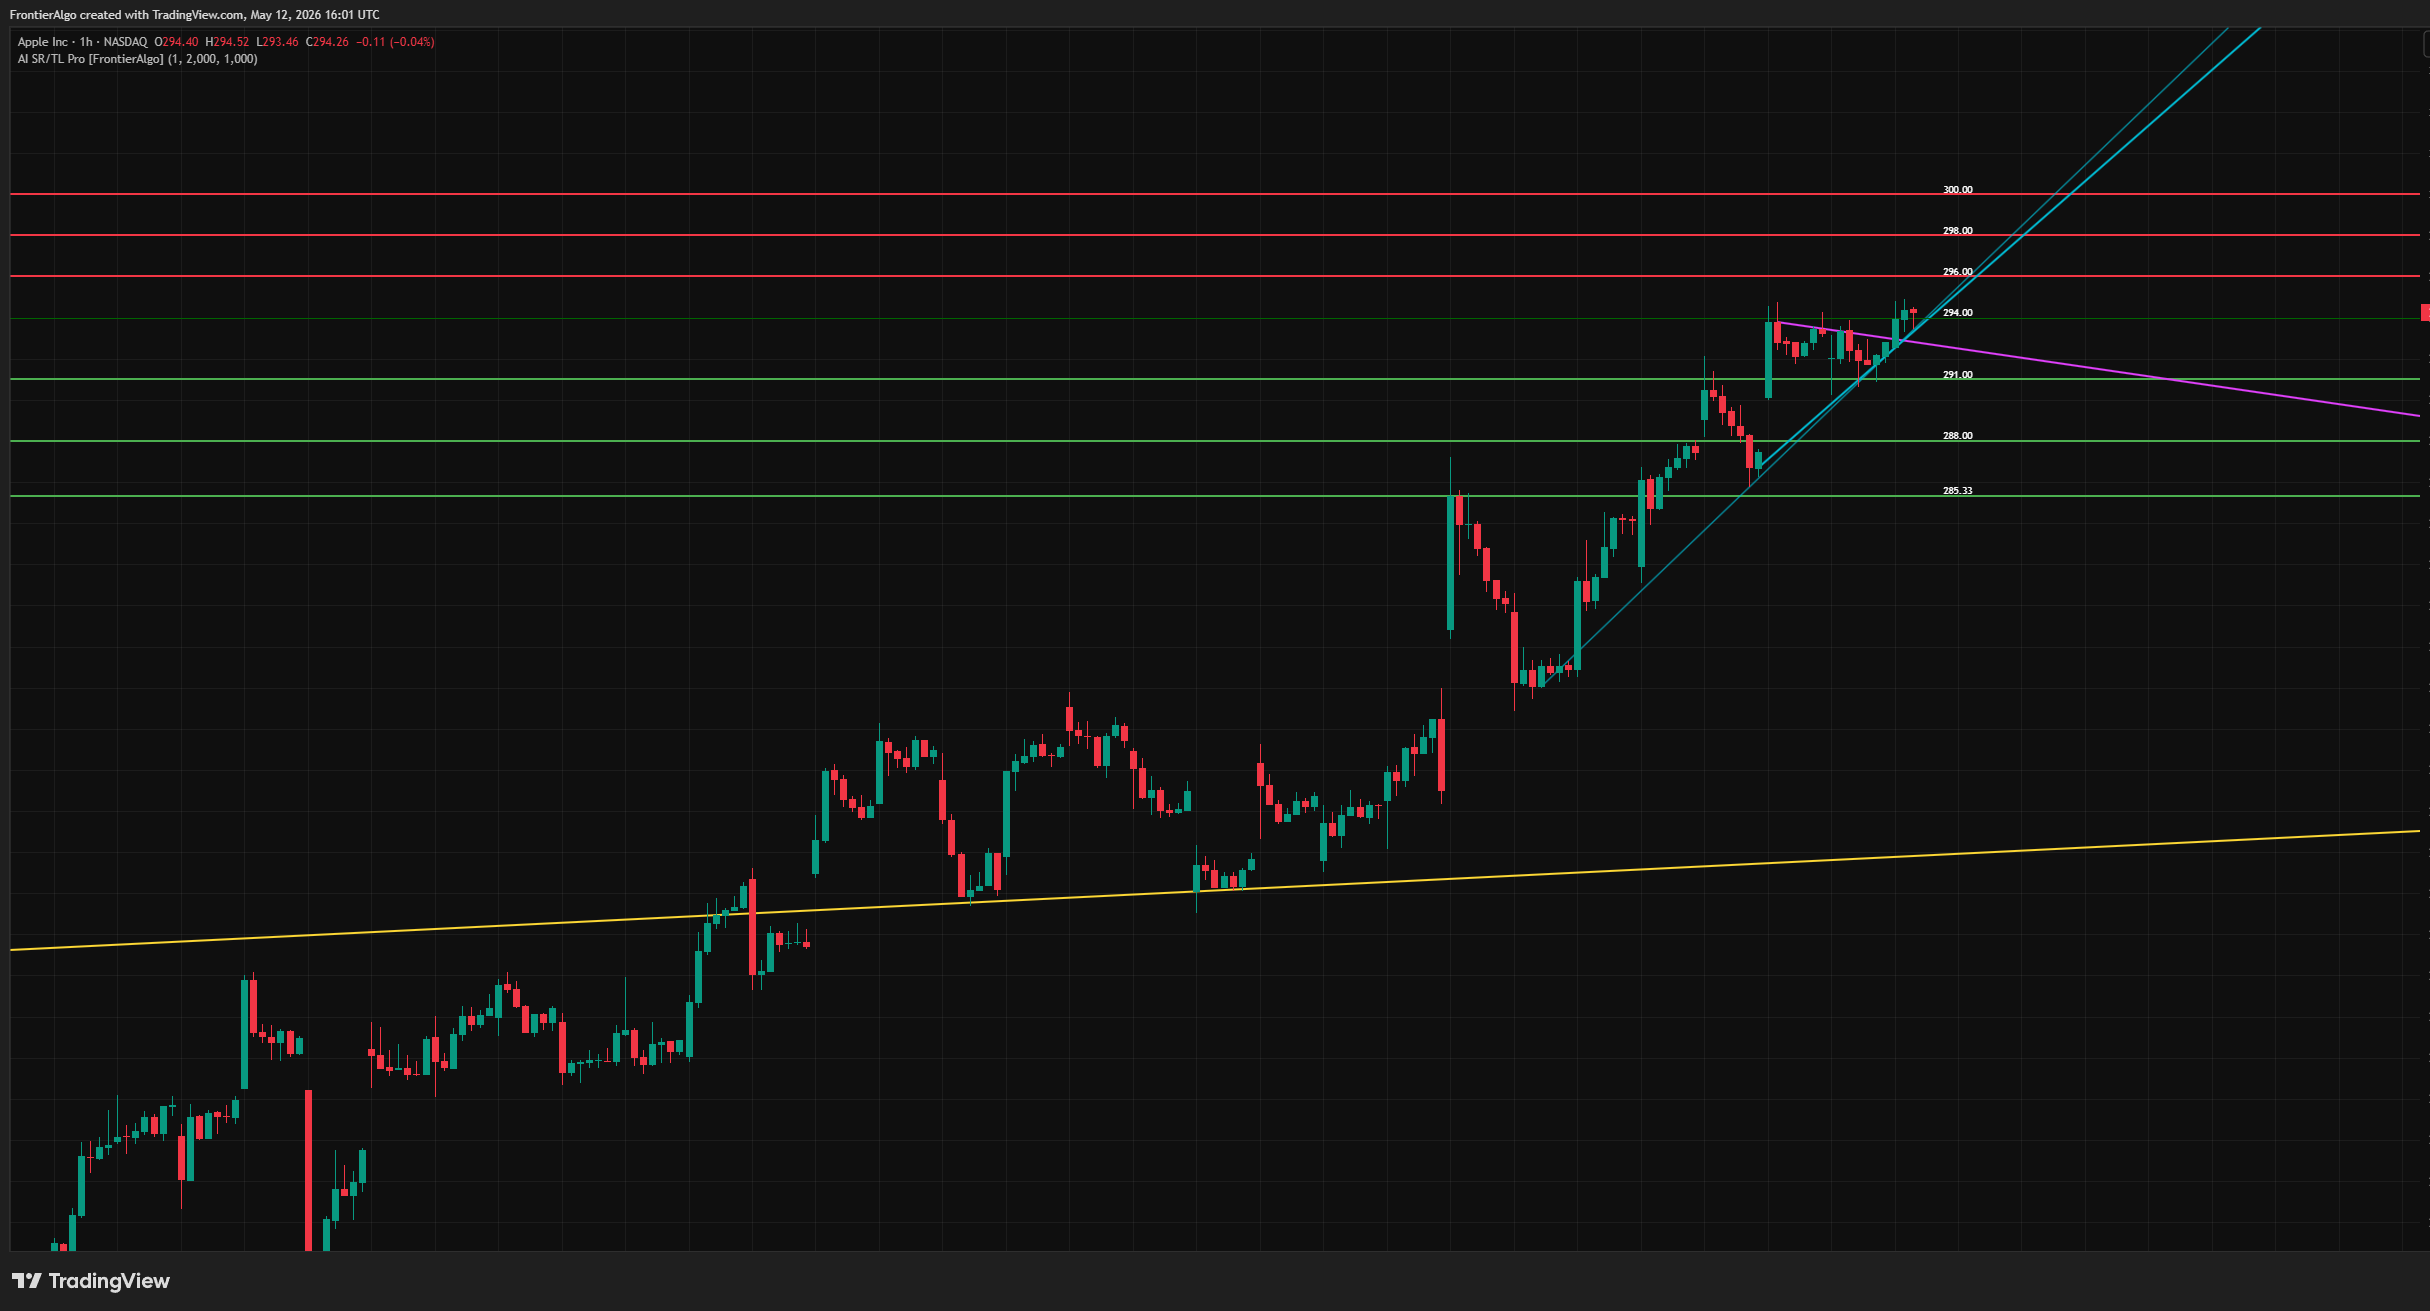
Hypothetical/historical example. CFTC Rule 4.41: results shown are based on historical data and do not represent actual trading. Past performance does not indicate future results.
One disclosure about these captures. The horizontal levels in every shot above are exactly what the current build draws: bright red and dull maroon for resistance, bright green and dark forest green for support. We checked that pixel by pixel.
The diagonals are worth a word. The EUR/USD chart carries an orange line, and the USD/JPY crop higher up this page carries an orange one and a yellow one. Those are the older trend lines, drawn off longer swings, and the shipping build leaves them switched on. The current pair is cyan ascending and magenta descending. All ten colors are pickers you can change, and the older pair has its own on/off switch.
Six Things This Will Not Do
There are no customer testimonials on this page because there are none to show yet. Instead, here is the list a testimonial would never tell you.
It will not tell you to buy or sell
No entry markers, no arrows, no trade calls. It draws levels and grades them. Every decision at those levels is yours, and that is deliberate.
It will not ping your phone
There are no built-in alerts in this indicator. You can set a normal TradingView alert at any price it prints, which is why every level carries its own number, but the alert is one you create.
It will not leave a trail behind it
Levels are redrawn on the latest bar to show the current state of the market. Scroll back a month and you are looking at today's levels on old candles, not a museum of what it said in July.
Some levels are round numbers, not found structure
When a side has fewer than three real levels, the engine fills it in off a round-number grid sized to the instrument. Those fills are then scored like every other level, so one can draw bright and thick. The tell is the spacing: on the EUR/USD capture above, the supports step down in exact 0.0005 increments, which is that grid.
One setting can flatten the ranking
SR Line Weight adds to the width the score has already assigned, and the total is clamped between 1 and 5. At the shipped default of 1 you get three visible tiers. Turn it up to the top of its range and every level draws at maximum width, which erases the thickness ranking you came for.
It has no long history to lean on
This indicator shipped in 2026. It is new, and we are not going to dress it up as a decade-old system. What we can show you is the code's behavior and real captures off real charts, which is what this page does.
Exactly What Happens After You Pay
The three steps, in full
- Check out through Whop®, our Merchant of Record.
- In your Whop dashboard, enter your exact TradingView® username and click Claim.
- In TradingView, open Indicators → Invite-Only and apply FA - AI SR/TL Pro. Settings live on the gear icon beside its name in the chart legend.
Takes about a minute. The username is case-sensitive, so copy it from your profile URL. Load at least 300 bars of history so the engine has a training window to work with.
What comes with it
- Invite-only Pine Script™ that runs on every TradingView plan, including the free tier
- Nothing to download or install, since it renders inside your own TradingView chart
- Complete documentation plus a quick-install guide
- Human help by email through the FrontierAlgo Support Hub
- Every future update included, with no recurring fees
Access guarantee. If we can’t deliver access to AI SR/TL Pro on your TradingView® account, you get your money back. Email support@frontieralgo.com first. Usually it is a mistyped TradingView username, and that takes about two minutes to sort out.
Past that, all sales are final. What you get: AI SR/TL Pro on TradingView, the complete documentation and quick-install guide, every future update at no extra cost, and human help by email through our Support Hub. No indicator can promise you a profitable trade, and we do not. Full terms are on the refund policy page.
Merchant of Record: Whop® handles payment processing, sales-tax collection and customer billing. Checkout runs over 256-bit SSL on Whop's own servers.
Answered Honestly, Including The Unflattering Parts
One Payment. No Subscriptions. No Renewal Date.
AI Support & Resistance and Trend Lines Pro
One-time payment · Built for TradingView® · All future updates included
Paid once. No subscription, no renewal, no upsell.
The complete billing schedule
- TodayOne payment
- Next monthNothing
- Next yearNothing
- Renewal dateNone
- Card kept on fileNone
LuxAlgo’s Ultimate tier lists at $119.99 a month on monthly billing, or $719.88 a year if you commit annually. TrendSpider’s cheapest paid plan, Standard, lists at $82 a month, or $648 a year annually, billed for as long as you keep using it. These competitor prices verified 2026-08-28 on each vendor's own pricing page, as listed August 2026. Both vendors were running promotional discounts that day, so check their current number before you compare. You pay for AI SR/TL Pro one time. No renewal date, no card kept on file, and no month where you pay again for the same tool.
Sales are final, with one exception: if we can’t deliver access to the indicator on your TradingView® account, email support and we’ll fix it or refund you in full. This is a technical-analysis indicator, not a trade-recommendation service. Trading involves substantial risk of loss and results are not guaranteed.
One payment. No recurring fees, ever. The price on this page is the complete cost: no subscription, no renewal date, no card kept on file, and no separate charge for updates or support. Whop® is the Merchant of Record and collects any sales tax your jurisdiction requires at checkout.
Important Risk Disclosure
CFTC RULE 4.41 - HYPOTHETICAL OR SIMULATED PERFORMANCE RESULTS HAVE CERTAIN LIMITATIONS. Unlike an actual performance record, simulated results do not represent actual trading. Also, since the trades have not been executed, the results may have under-or-over compensated for the impact, if any, of certain market factors, such as lack of liquidity. Simulated trading programs in general are also subject to the fact that they are designed with the benefit of hindsight. No representation is being made that any account will or is likely to achieve profit or losses similar to those shown.
THIS IS NOT FINANCIAL ADVICE. AI Support & Resistance and Trend Lines Pro and all associated materials are provided for informational and educational purposes only. Nothing herein constitutes investment advice, a solicitation, recommendation, or offer to buy or sell any securities or financial instruments. We are not registered investment advisors. Trading involves substantial risk of loss. You may lose more than your initial investment. Consult with a qualified financial advisor before making any investment decisions.
AI SCORING DISCLOSURE: The ML strength scores displayed by AI Support & Resistance and Trend Lines Pro represent the degree of agreement among the indicator's machine learning models regarding the significance of a support or resistance level. These scores do NOT represent win rates, success rates, or the probability of profit. A high score means the AI models agree the level is significant, not that price will respect it. All trades carry risk regardless of score readings.
RETAILER DISCLOSURE: Please note that this product does not provide any guarantee of income or success. The results achieved by the product owner or any other individuals mentioned are not indicative of future success or earnings. This website is not affiliated with Facebook or any of its associated entities. Once you navigate away from Facebook, the responsibility for the content and its usage lies solely with the user. All content on this website, including but not limited to text, images, and multimedia, is protected by copyright law and the Digital Millennium Copyright Act. Unauthorized copying, duplication, modification, or theft, whether intentional or unintentional, is strictly prohibited. Violators may be subject to legal action.
Whop serves as the Merchant of Record for the products featured on this site. Whop® is a registered trademark of Whop, Inc. and is used with permission. As the Merchant of Record, Whop is responsible for payment processing, sales-tax collection and remittance, and customer billing. The role of Whop as a Merchant of Record does not constitute an endorsement, approval, or review of these products or any claims, statements, or opinions used in their promotion.
About access: Your purchase is a single one-time payment that includes all future updates to the product, with no subscriptions and no recurring fees. The full terms of access are set out in our Risk Disclosure, Terms & Privacy Policy.
All trading decisions are made at your own risk. See our full Risk Disclosure, Disclaimers & Privacy Policy page.